Kubernetes Test 02: AKS, Gateway API, and Full Observability
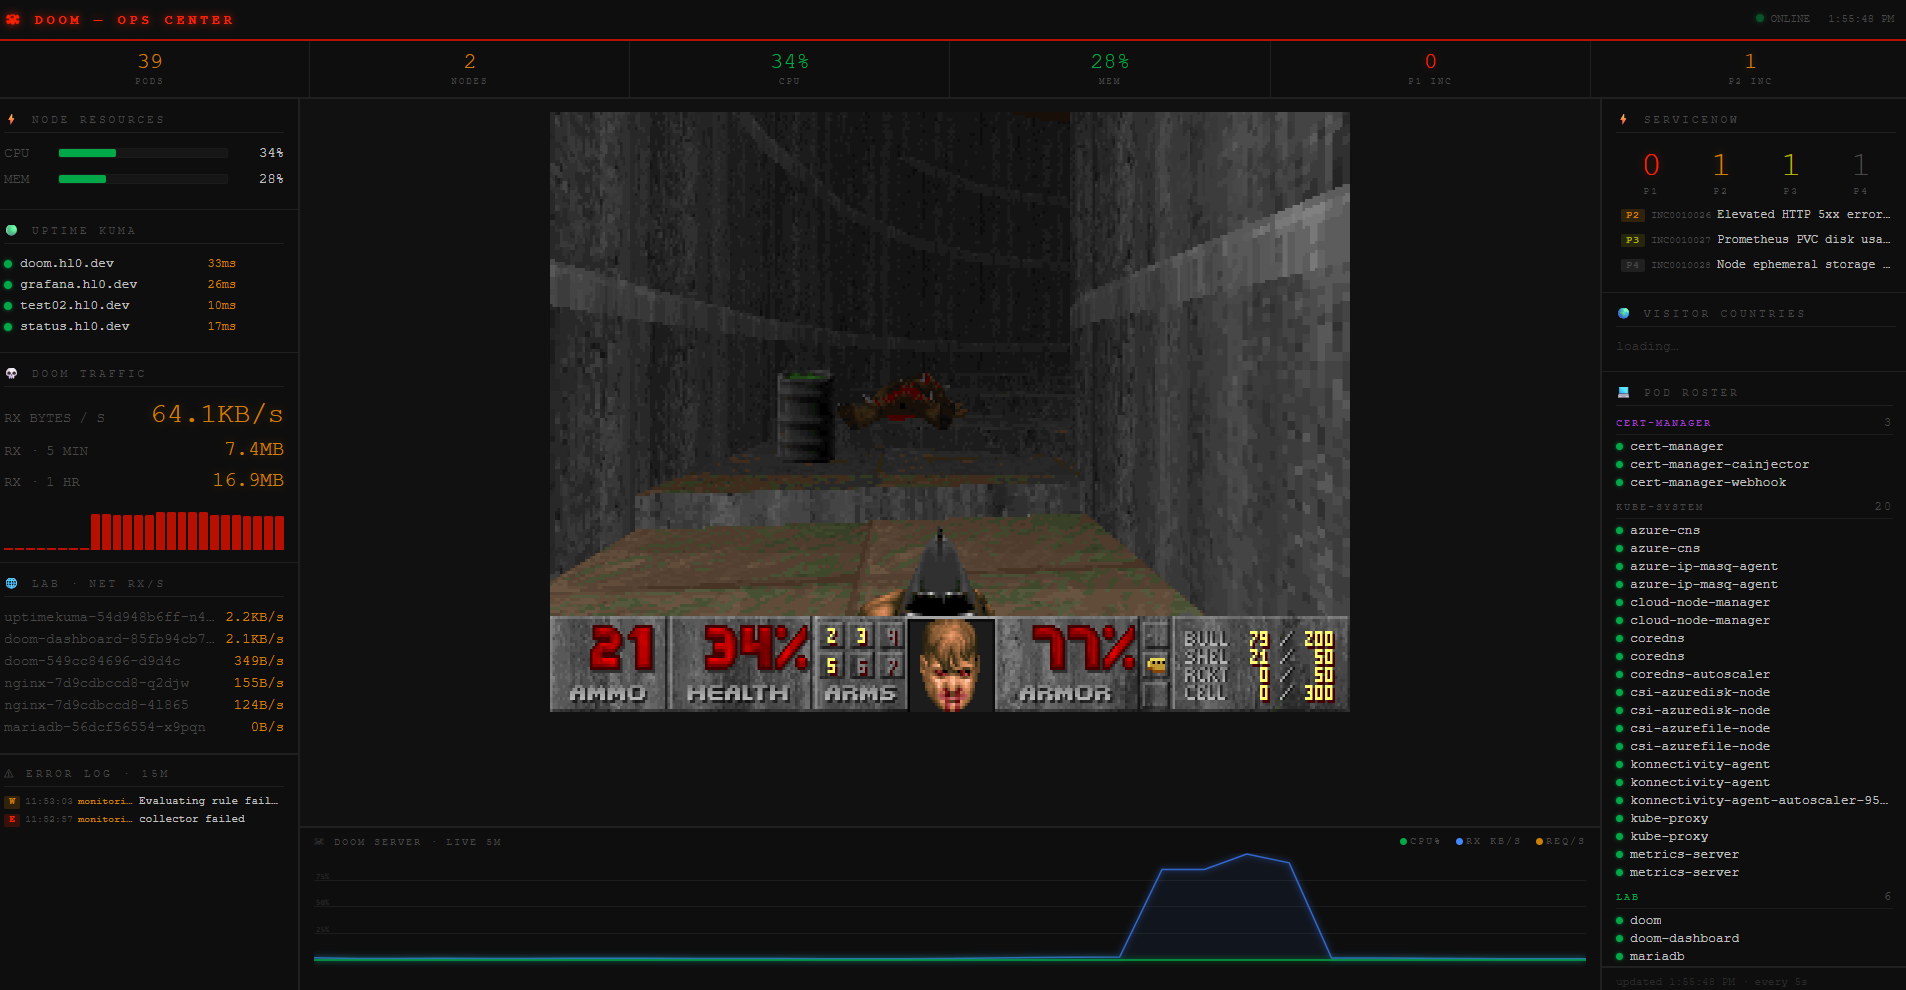
A follow-up to Kubernetes Test 01, this time on Azure Kubernetes Service with a production-closer stack: Gateway API ingress, automatic TLS, a full observability suite, and a custom dashboard.
The full source is at github.com/hermanl0/k8s-test02. The lab was live at doom.hl0.dev, now shut down.
Architecture Overview
| Component | What it does |
|---|---|
| AKS | Managed Kubernetes cluster on Azure |
| NGINX Gateway Fabric | Gateway API ingress controller |
| cert-manager | Automatic TLS via Let’s Encrypt |
| CloudNativePG | 3-instance PostgreSQL 16 HA cluster (1 primary, 2 replicas) |
| pgBouncer | Connection pooler in front of PostgreSQL |
| MinIO | S3-compatible object storage for WAL archiving and daily backups |
| kube-prometheus-stack | Prometheus + Grafana + Alertmanager |
| Loki + Promtail | Log aggregation |
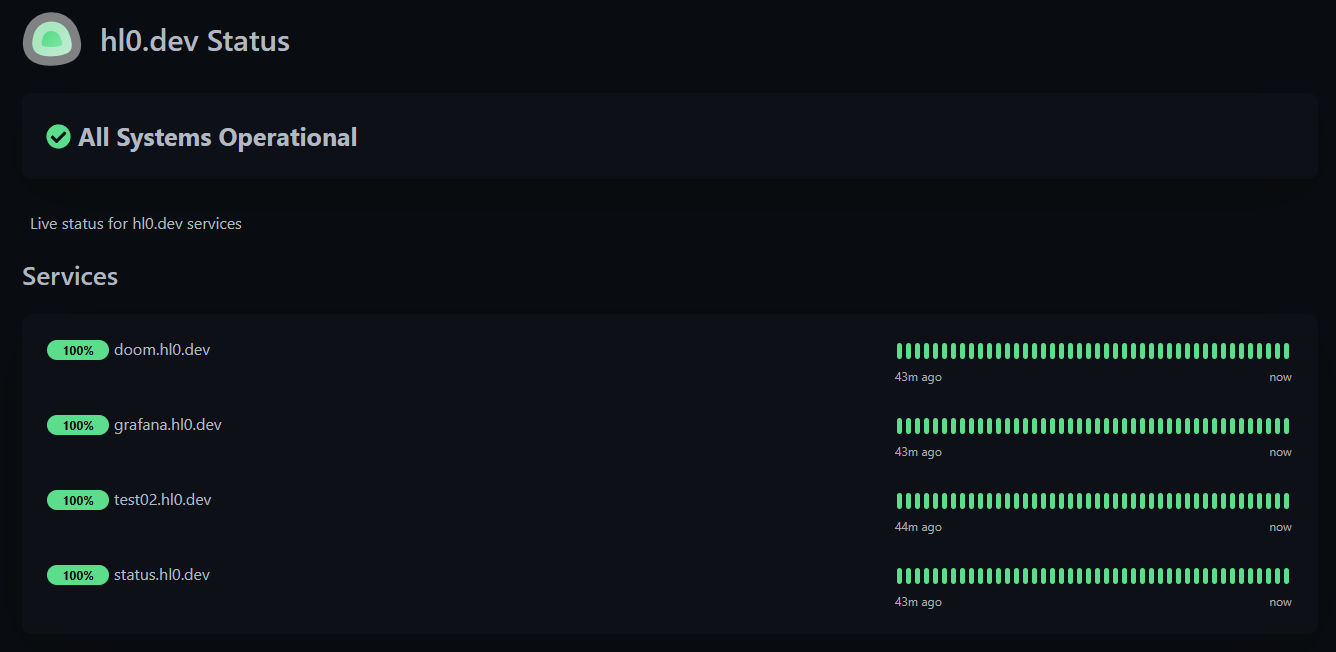
| Uptime Kuma | Public status page |
| Doom dashboard | Custom Flask app with live cluster metrics |
Step 1: Provision the cluster
az group create --name lab-rg --location westeurope

az aks create \
  --resource-group lab-rg \
  --name lab-aks \
  --node-count 2 \
  --node-vm-size Standard_B2s \
  --enable-managed-identity \
  --generate-ssh-keys

az aks get-credentials --resource-group lab-rg --name lab-aks
Step 2: Install NGINX Gateway Fabric
ingress-nginx reached end-of-life in March 2026, so this project uses its replacement: NGINX Gateway Fabric, which implements the Kubernetes Gateway API.
# Install Gateway API CRDs
kubectl apply -f https://github.com/kubernetes-sigs/gateway-api/releases/download/v1.2.0/standard-install.yaml

# Install NGF via OCI helm chart
helm upgrade --install nginx-gateway-fabric \
  oci://ghcr.io/nginxinc/charts/nginx-gateway-fabric \
  --namespace nginx-gateway \
  --create-namespace \
  --values k8s/helm/nginx-gateway-fabric-values.yaml
Gateway resources replace Ingress objects. A GatewayClass and Gateway define the entry point; HTTPRoute objects attach to it per hostname:
apiVersion: gateway.networking.k8s.io/v1
kind: Gateway
metadata:
  name: lab-gateway
  namespace: lab
spec:
  gatewayClassName: nginx
  listeners:
  - name: doom-https
    hostname: doom.hl0.dev
    port: 443
    protocol: HTTPS
    tls:
      mode: Terminate
      certificateRefs:
      - kind: Secret
        name: doom-tls
    allowedRoutes:
      namespaces:
        from: All
Step 3: Automatic TLS with cert-manager and Cloudflare
cert-manager issues Let’s Encrypt certificates automatically. DNS-01 challenge via Cloudflare works without any inbound port open:
apiVersion: cert-manager.io/v1
kind: ClusterIssuer
metadata:
  name: letsencrypt-prod
spec:
  acme:
    server: https://acme-v02.api.letsencrypt.org/directory
    email: [EMAIL]
    privateKeySecretRef:
      name: letsencrypt-prod-key
    solvers:
    - dns01:
        cloudflare:
          apiTokenSecretRef:
            name: cloudflare-api-token
            key: api-token
A Certificate resource in the lab namespace produces a Secret the Gateway can reference directly:
kubectl get certificate -n lab
> NAME          READY   SECRET        AGE
> doom-tls      True    doom-tls      2d
> grafana-tls   True    grafana-tls   2d
> status-tls    True    status-tls    2d
> test02-tls    True    test02-tls    2d
Step 4: Observability — Prometheus, Grafana, and Loki
Both stacks deployed via Helm into the monitoring namespace:
helm upgrade --install kube-prometheus-stack \
  prometheus-community/kube-prometheus-stack \
  --namespace monitoring \
  --values k8s/helm/kube-prometheus-stack-values.yaml

helm upgrade --install loki-stack \
  grafana/loki-stack \
  --namespace monitoring \
  --values k8s/helm/loki-stack-values.yaml
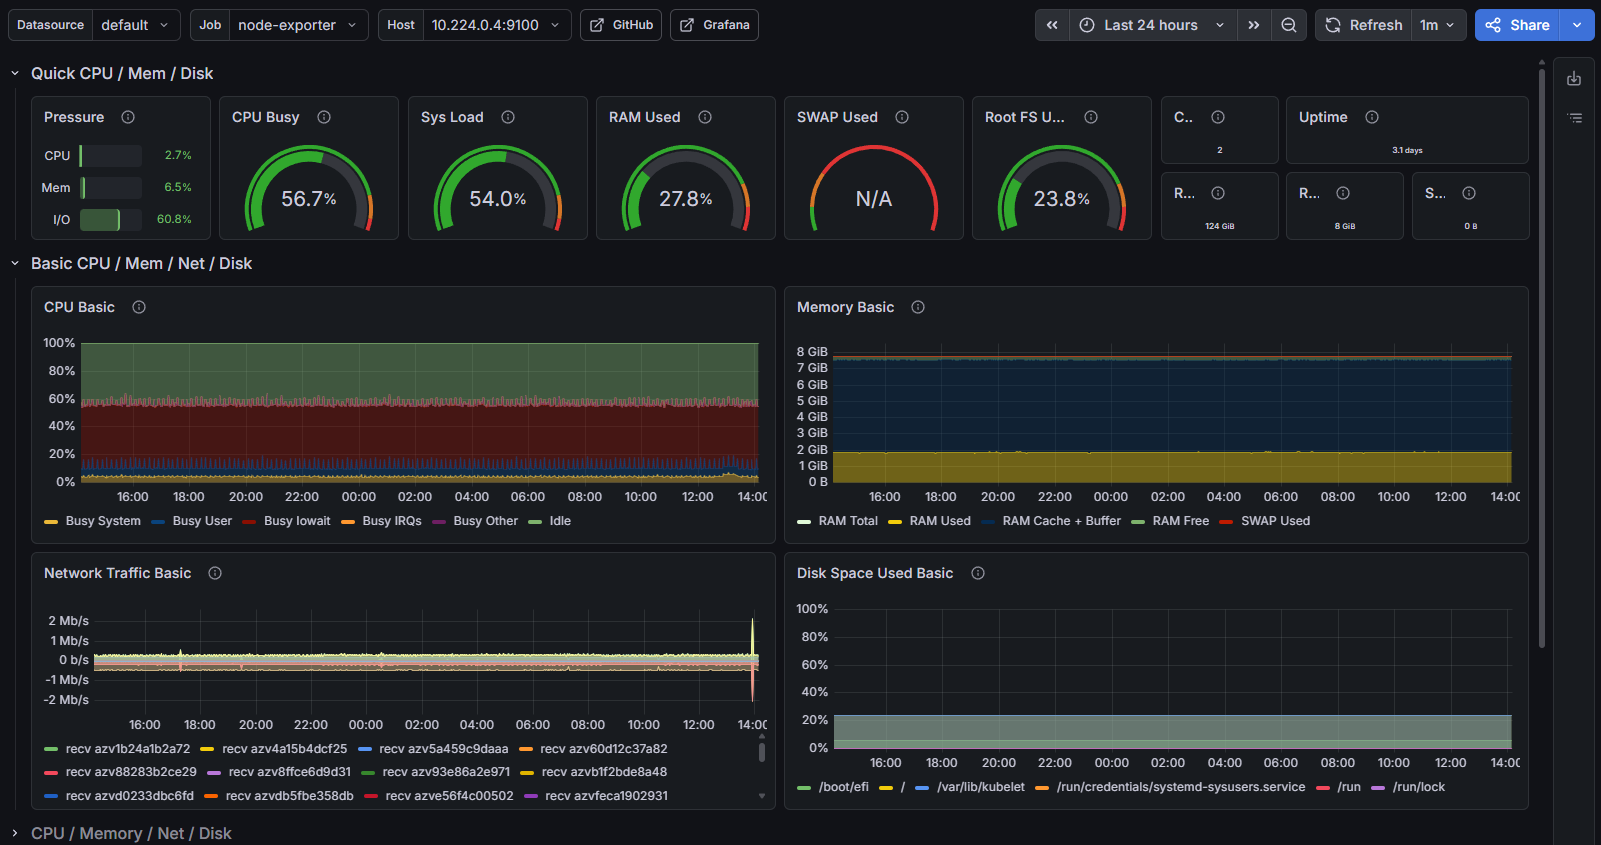
NGF exposes a Prometheus metrics endpoint on port 9113. A ServiceMonitor picks it up automatically so NGF request metrics land in Grafana alongside cluster and node metrics.
Step 5: The Doom Dashboard
A small Flask app in the lab namespace that pulls from Prometheus and the ServiceNow API and renders a terminal-style HTML page.
kubectl get pods -n lab
> NAME                             READY   STATUS    RESTARTS
> doom-0                           1/1     Running   0
> doom-dashboard-[HASH]            1/1     Running   0
> nginx-[HASH]                     1/1     Running   0
> pgbouncer-[HASH]                 1/1     Running   0
> uptimekuma-[HASH]                1/1     Running   0
The dashboard shows live pod network metrics, open ServiceNow incidents, and embeds Uptime Kuma monitor statuses — all over HTTPS via the Gateway.
Step 6: PostgreSQL HA with CloudNativePG
Instead of a single-replica MySQL/MariaDB, the lab runs a proper HA database stack:
- CloudNativePG operator manages a 3-instance PostgreSQL 16 cluster — one primary, two streaming replicas with automatic failover
- pgBouncer sits in front as a connection pooler; applications connect to pgBouncer, not directly to PostgreSQL
- MinIO provides S3-compatible object storage for continuous WAL archiving and daily full backups via pgBackRest
kubectl get cluster postgres -n lab
> NAME       AGE   INSTANCES   READY   STATUS                     PRIMARY
> postgres   1d    3           3       Cluster in healthy state   postgres-1

kubectl get backup -n lab
> NAME                STATUS      STARTED                STOPPED
> postgres-backup-1   completed   2026-05-30T02:00:00Z   2026-05-30T02:03:12Z
The full flow: app → pgBouncer:5432 → postgres-rw (primary) → WAL → MinIO
Step 7: Security hardening
NetworkPolicies default-deny all traffic in the lab namespace, with explicit allow rules per workload. Only the nginx-gateway namespace can reach application pods.
Rate limiting via NGF SnippetsFilter — injects raw NGINX config into the generated server block:
apiVersion: gateway.nginx.org/v1alpha1
kind: SnippetsFilter
metadata:
  name: rate-limit
  namespace: lab
spec:
  snippets:
  - context: http
    value: "limit_req_zone $binary_remote_addr zone=per_ip:10m rate=20r/s;"
  - context: http.server.location
    value: |
      limit_req zone=per_ip burst=60 nodelay;
      limit_req_status 429;
Security headers set on every HTTPS HTTPRoute via ResponseHeaderModifier:
filters:
- type: ResponseHeaderModifier
  responseHeaderModifier:
    set:
    - name: Strict-Transport-Security
      value: "max-age=31536000; includeSubDomains; preload"
    - name: X-Content-Type-Options
      value: nosniff
    - name: Referrer-Policy
      value: strict-origin-when-cross-origin
Step 8: CI/CD with GitHub Actions
A single workflow on push to main handles the full deploy: Azure login, helm upgrades, manifest apply, DNS update via Cloudflare API, and a final cluster state dump.
kubectl get gateway,httproute -A
> NAMESPACE   NAME                                    CLASS   ADDRESS          PROGRAMMED
> lab         gateway.../lab-gateway                  nginx   [CLUSTER-IP]     True

> NAMESPACE    NAME                                   HOSTNAMES
> lab          httproute.../doom-route                ["doom.hl0.dev"]
> lab          httproute.../grafana-route             ["grafana.hl0.dev"]
> lab          httproute.../status-route              ["status.hl0.dev"]
> monitoring   httproute.../grafana-route             ["grafana.hl0.dev"]
End.